
Watch a Bitcoin chart for a while and you will notice the price often bounces at the same levels again and again. Sometimes it falls to a certain point and then rises; sometimes it climbs to a certain point and cannot go further. These levels are support and resistance, the most basic tools for reading a chart.
This article explains what support and resistance are, why they form, how to find them on a chart, and how to use them to plan your crypto trades with discipline if you are new to investing in digital assets.
What Are Support and Resistance?
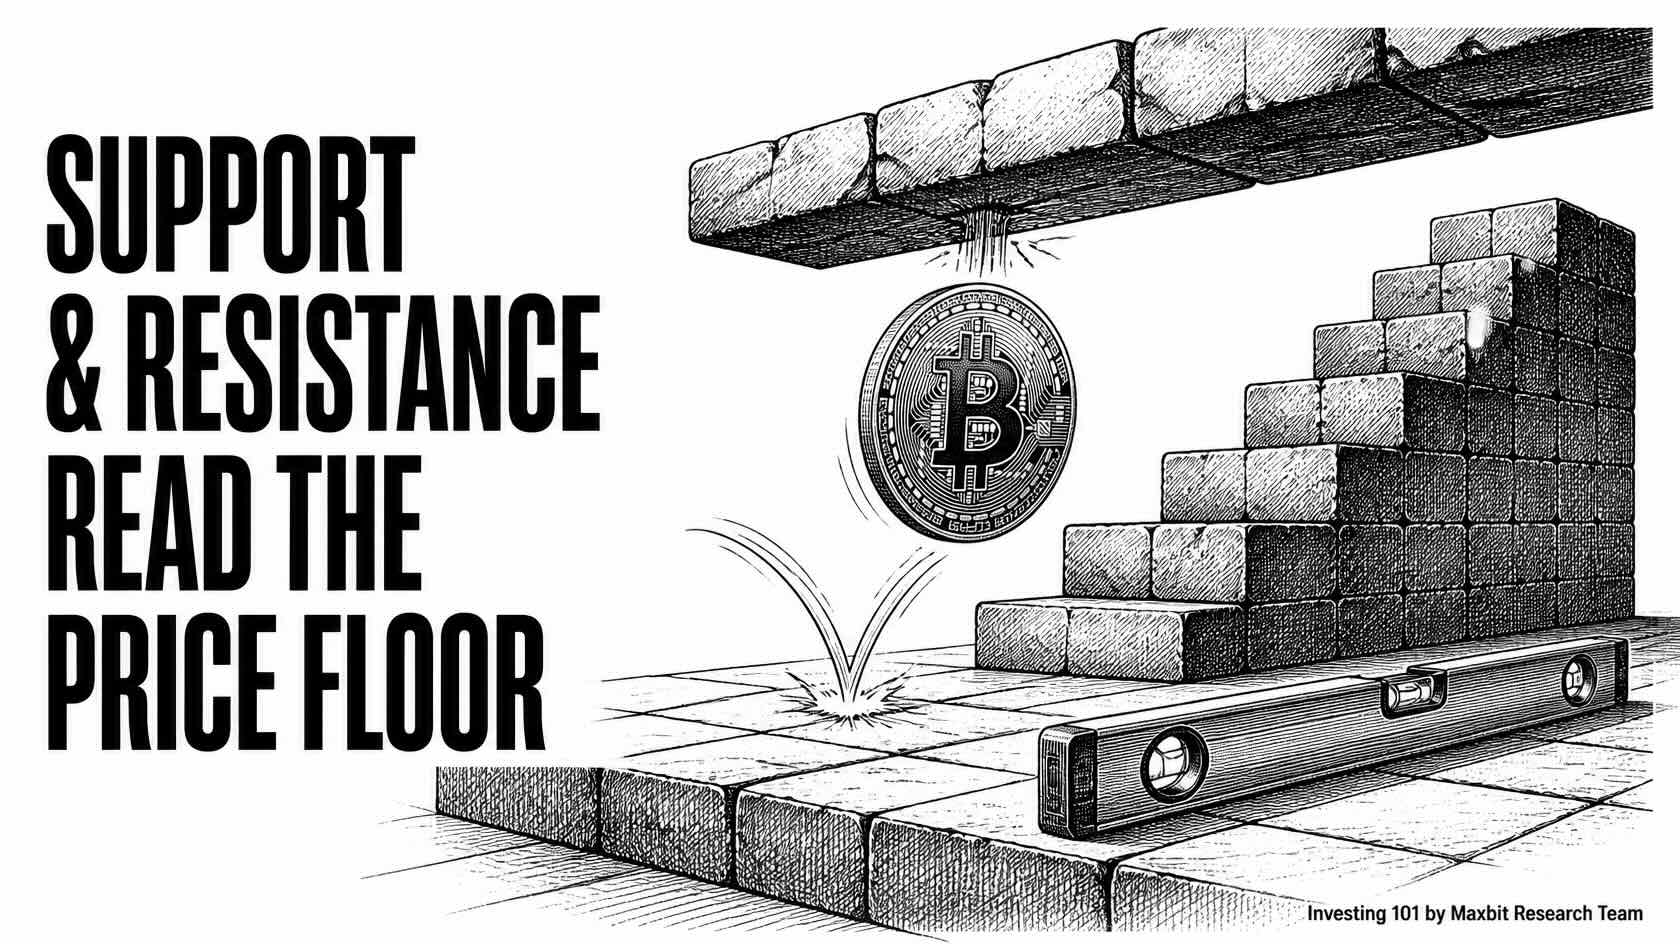
Support is a price level where a falling price tends to stop and bounce back up, because many buyers are waiting there. Resistance is a price level the price tends to fail to break above, because many sellers are waiting there.
Why Support and Resistance Form
- Market memory. Investors remember where they bought or sold and often make decisions again at the same levels.
- Waiting orders. Many limit orders sit at key price levels.
- Round numbers. Levels such as THB 3,000,000 or USD 100,000 are where many people set buy or sell targets.
4 Ways to Find Support and Resistance on a Chart
- Find past turning points. Draw a horizontal line through lows or highs where the price has bounced at least 2–3 times.
- Think in zones, not single lines. Price often swings slightly around a level, so mark a narrow price range.
- Start with a larger timeframe. Levels on daily or weekly charts tend to be stronger than on hourly charts.
- Check trading volume. Levels that saw high volume usually matter more.
If you are not yet comfortable reading price bars, start with What Is a Candlestick Chart?
Breakouts and Role Reversal
When the price clearly breaks above resistance, it is called a breakout. The old resistance often becomes new support (role reversal). Likewise, if the price falls through support, the old support often turns into resistance.
- A reliable breakout usually comes with high volume and a candle that closes above the level, not just a wick poking through.
- A fake breakout is when price briefly breaks a level and then falls back. It is common in a crypto market that trades 24 hours a day.
⚠️ Support and resistance are zones where a reversal is more likely, not prices that guarantee a bounce. Always plan a stop-loss when you use them to make decisions.
Using Support and Resistance to Plan Trades
- Place buy orders near support with a limit order instead of chasing the price.
- Set a stop-loss slightly below support to allow for normal price swings. Read more in What Are Stop-Loss and Take-Profit?
- Set profit targets just below resistance, because price often slows as it nears the ceiling.
- No time to watch charts? DCA may suit you better.
Common Beginner Mistakes
- Drawing too many lines until the chart is cluttered with meaningless levels. Keep only the 2–3 clearest ones.
- Assuming support always holds. A level tested many times can weaken and break.
- Buying the moment price touches a level without waiting for confirmation, such as a reversal candle.
Frequently Asked Questions About Support and Resistance
Do support and resistance work for crypto?
Yes, just as for stocks or gold. But crypto is highly volatile and trades 24 hours a day, so treat levels as zones and use larger timeframes too.
Which levels are the strongest?
Levels where price has touched and bounced many times, that show up on larger timeframes, and that saw high volume.
Should I buy right after a breakout?
Not necessarily. Many traders wait for price to pull back and retest the old resistance as new support, to reduce the risk of a fake breakout.
Practice Reading Support and Resistance on a Licensed Platform
Support and resistance show you whether price is near a floor or a ceiling, so you can plan entries, exits and stop-losses with a clear rationale. Do not rely on them alone, and manage your risk every time.
Open your Maxbit account today to view charts and trade Bitcoin and USDT on a platform regulated by the Thai SEC.
Risk warning: Cryptocurrencies and digital tokens are highly risky. You may lose your entire investment. Chart analysis does not guarantee returns. Please study and understand the risks before deciding to invest.