
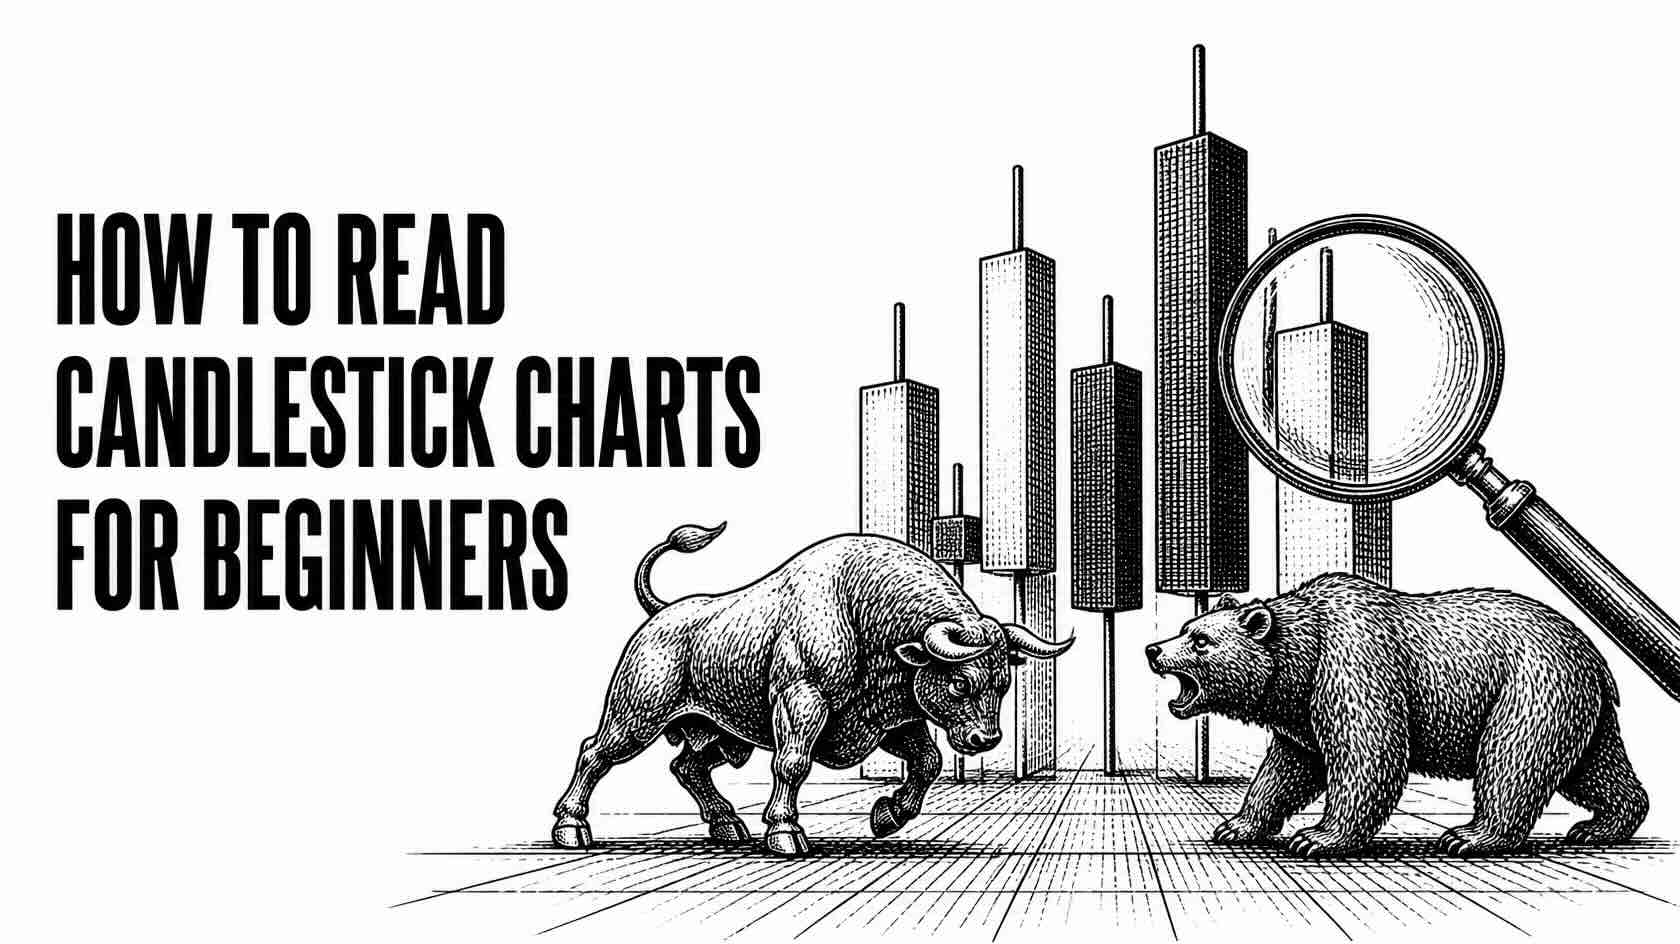
The first time you open a crypto trading app, the screen is full of green and red bars. Many people find it confusing and do not know where to start. These bars form a candlestick chart, the basic tool investors worldwide use to follow price movements in stocks, gold and Bitcoin.
This article explains what each candle tells you, how to read it part by part, the common basic patterns, and what to watch out for when using charts to trade digital assets, so you understand the market better before you decide.
What Is a Candlestick Chart?
A candlestick chart shows four pieces of information in a single candle: the open, high, low and close prices, often shortened to OHLC, for a chosen period such as 15 minutes, 1 hour or 1 day.
The chart originated with Japanese rice traders hundreds of years ago and is still the standard on almost every investment platform today, because it is easy to read and shows buying and selling pressure more clearly than a line chart.
The Parts of a Candlestick
Body
The thick part of the candle shows the range between the open and close prices.
- Green candle (bullish): the close is higher than the open, so the price rose during that period.
- Red candle (bearish): the close is lower than the open, so the price fell.
Wick (Shadow)
The thin lines above and below the body. The tip of the upper wick is the highest price and the tip of the lower wick is the lowest price in that period. A long wick means the price travelled far but was pulled back by the other side.
Timeframe: How Much Time Does One Candle Cover?
Each candle represents the period you choose. On a 1-day (1D) timeframe, for example, one candle shows the price movement for the whole day. For long-term investors, daily or weekly charts show the trend more clearly and help you avoid reacting to short-term swings.
Basic Candlestick Patterns Beginners Should Know
- Marubozu: a long body with very short or no wicks, showing that buyers or sellers controlled the market for the whole period.
- Doji: the open and close are almost the same, with a very thin body, reflecting market indecision.
- Hammer: a small body near the top with a long lower wick, often seen after a fall, showing buyers pushing the price back up.
- Shooting star: a small body near the bottom with a long upper wick, often seen after a rise, showing sellers pressing the price down.
- Engulfing: a new candle whose body fully covers the previous one, which may signal that the opposite side is taking control.
⚠️ Candlestick patterns are statistical signals, not accurate predictions. The crypto market runs 24 hours a day and is highly volatile, so false signals are common.
4 Steps to Read Crypto Charts as a Beginner
- Choose a timeframe that matches your goal. Long-term investors should use daily or weekly charts.
- Look at the bigger trend to see whether the price keeps making new highs or new lows.
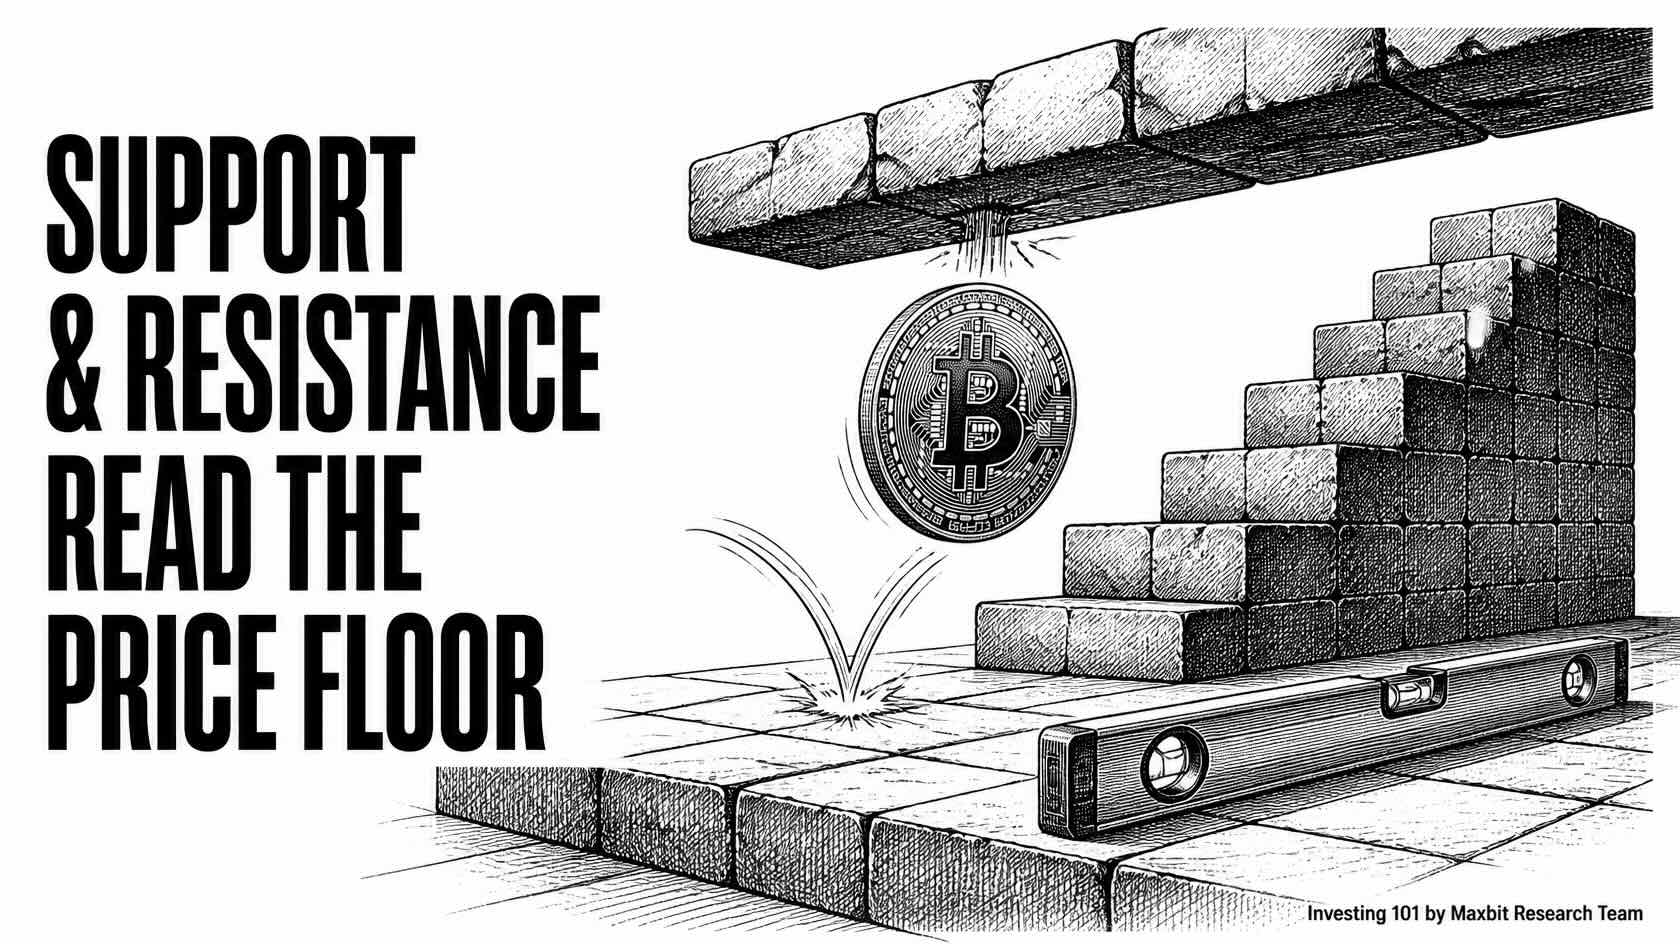
- Find support and resistance, the price levels where the market has bounced several times.
- Check trading volume. Signals that come with high volume tend to be more reliable.
Charts Alone Are Not Enough: Combine Them with Risk Management
Reading charts helps you understand market timing, but it should not be your only tool. If you do not have time to watch the screen, DCA may suit you better. If you trade using charts, you should:
- Set a stop-loss in advance every time.
- Avoid putting a large sum into one trade based on a single candle.
- Use limit orders to control your buy or sell price. Read more in Market Order vs. Limit Order.
Frequently Asked Questions About Candlestick Charts
Does a green candle mean I should buy?
Not always. A green candle only tells you the close was higher than the open in that period. Look at the bigger trend and other factors too.
Which timeframe should beginners use?
If you invest for the medium to long term, start with daily or weekly charts. They show the trend more clearly and reduce false signals.
Do candlestick charts work for every coin?
They work for any asset, but coins with low liquidity may have irregular charts with signals that are harder to read.
Practice Reading Charts on a Licensed Platform
The candlestick chart is a basic every investor should understand. Start by reading OHLC fluently, look at the bigger trend, and always combine charts with risk management.
Open your Maxbit account today to view price charts and trade Bitcoin and USDT on a platform regulated by the Thai SEC.
Risk warning: Cryptocurrencies and digital tokens are highly risky. You may lose your entire investment. Chart analysis does not guarantee returns. Please study and understand the risks before deciding to invest.